Project information
- Category:Tableau
- Software Used :SQL, Tableau
- Project URL: www.github.com
Project Description
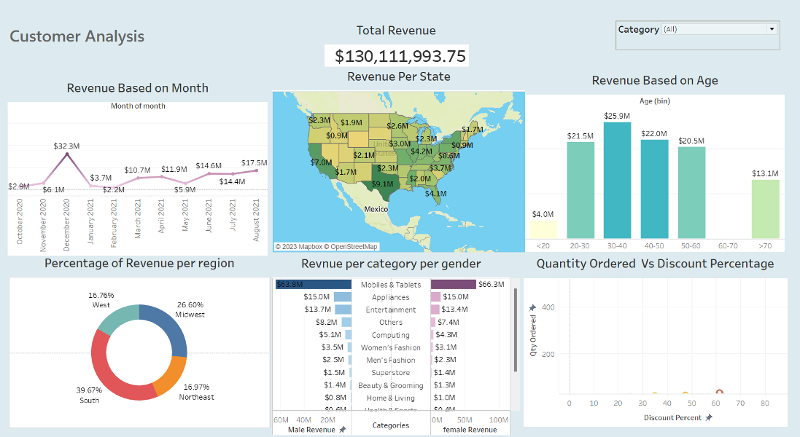
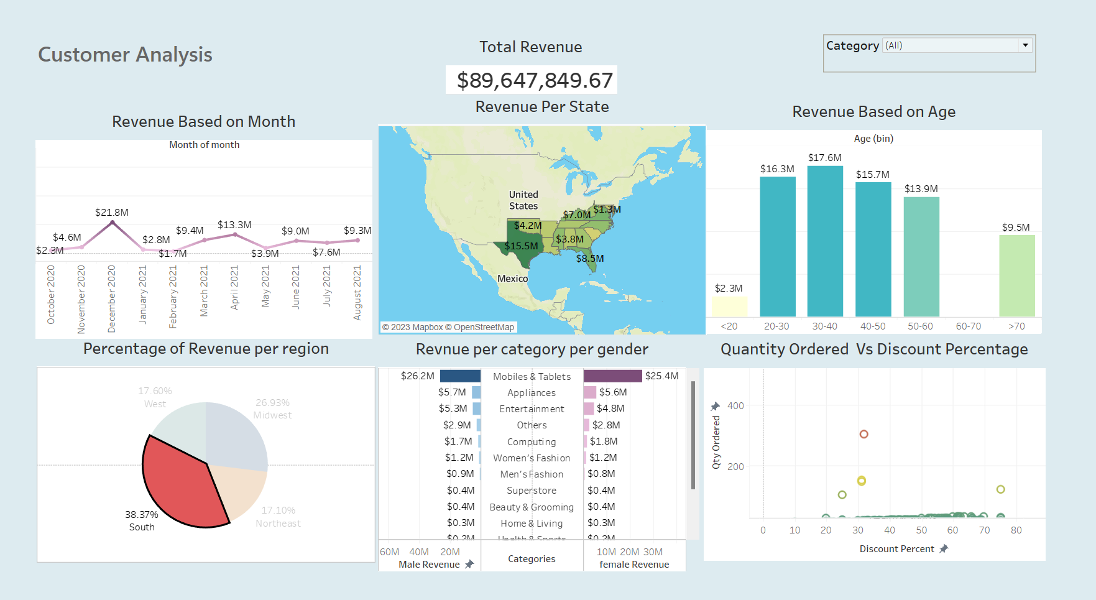
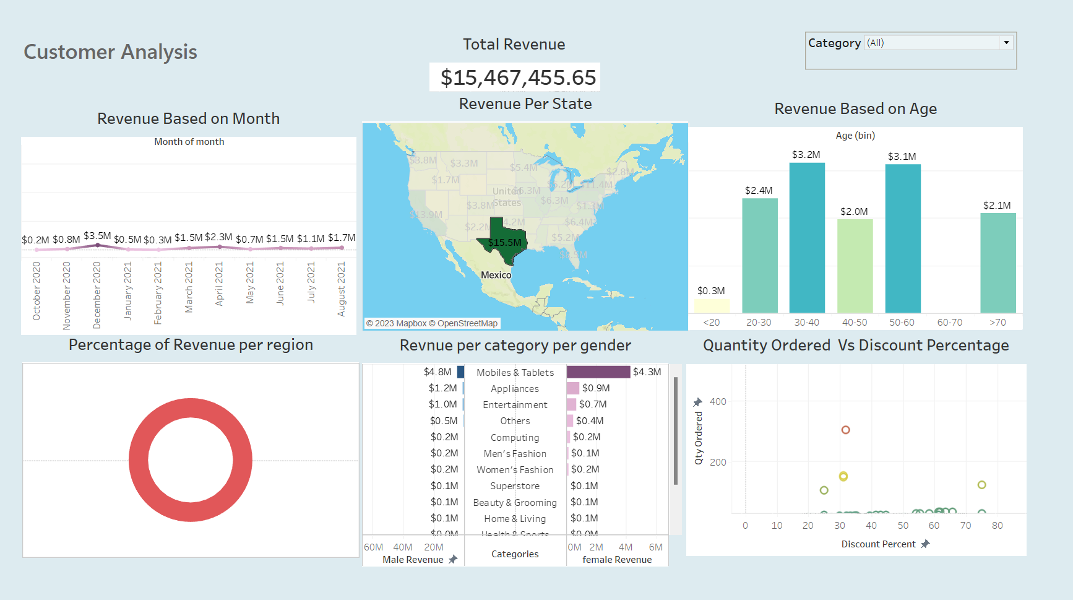
Explore the dynamic representation of sales over time, allowing for trend analysis and forecasting. Uncover sales performance by category and region, highlighting key areas of growth and opportunities. Furthermore, gain a comprehensive understanding of the impact of discount percentages on quantity ordered. Lastly, discover revenue distribution across different age groups, enabling targeted marketing strategies.
Project Description: Customer Analysis to Show the Various trends and patterns for effective targetted marketing strategies.
The journey of creating the customer analysis visualization was an insightful process. It began with choosing a suitable data set from kagle, followed by leveraging Tableau's capabilities. Visualizations were created to showcase sales over time, analyze sales by category and region, and explore the impact of discount percentages on quantity ordered. The project culminated in uncovering revenue distribution by age, providing valuable insights for targeted marketing strategies.
Key Features:
- Sales Over Time: The visualization provides a comprehensive view of sales trends over time, enabling trend analysis and forecasting to identify peak sales periods and seasonality.
- Sales by Category and Region: Analyzing sales by category and region allows for a deeper understanding of product performance and regional customer preferences, highlighting growth areas and opportunities for targeted marketing efforts.
- Quantity Ordered by Discount Percentage: By visualizing the relationship between quantity ordered and discount percentages, the project uncovers how varying discount levels influence customer behavior, providing insights for optimizing discount strategies.
- Revenue Distribution by Age: The visualization showcases the distribution of revenue across different age groups, helping businesses identify key customer segments and tailor marketing approaches to effectively reach and engage specific age demographics.
- User-Friendly Interface: The visualization is designed with a user-friendly interface, allowing stakeholders to interact with the data, explore different perspectives, and gain deeper insights through filters, tooltips, and other interactive features.
In conclusion, the customer analysis visualization project demonstrates the power of data visualization in unlocking valuable insights from customer data. By leveraging Tableau's capabilities, we have successfully explored sales trends over time, sales by category and region, quantity ordered by discount percentage, and revenue distribution by age. These key features provide businesses with actionable insights for informed decision-making, targeted marketing strategies, and optimizing discount strategies. The project emphasizes the importance of data-driven approaches and highlights the ability to effectively communicate complex information through visually engaging representations.