Project information
- Category: Data Visualization
- Software Used: Miscrosoft Power BI
- Project URL: www.github.com
Project Description
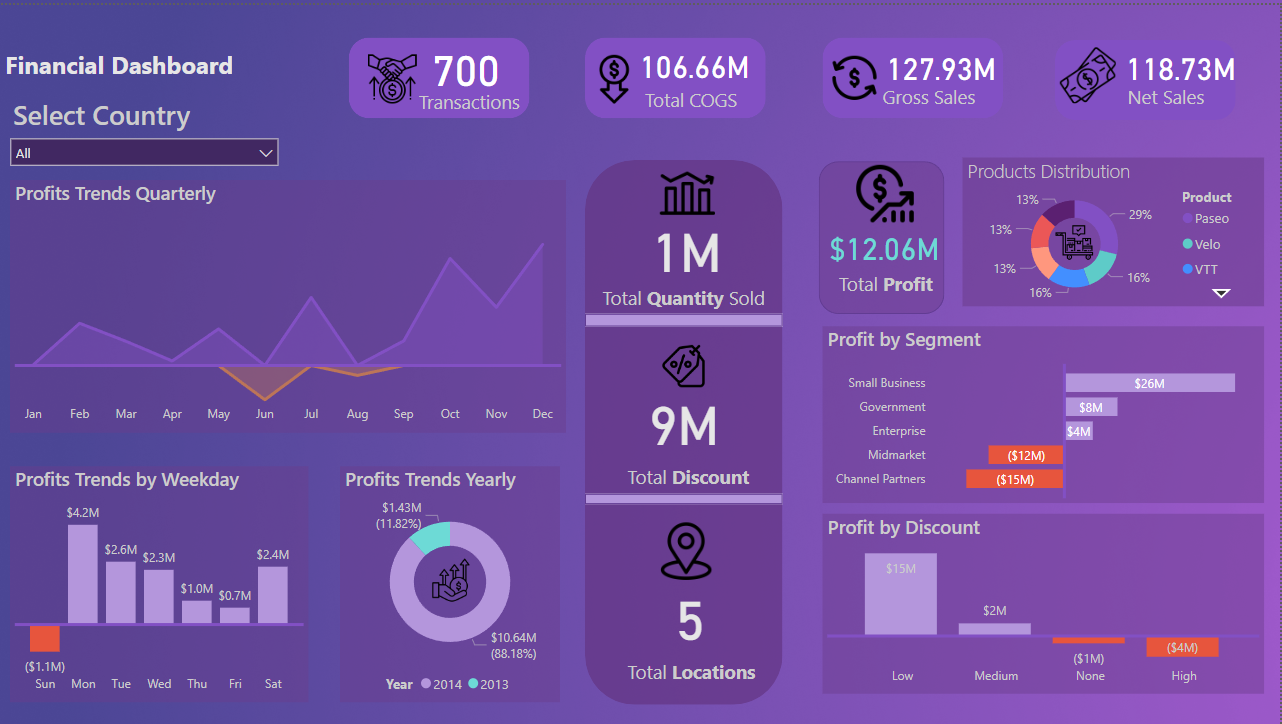
The Financial Dashboard project utilizes Power BI to present a concise and user-friendly visual representation of key financial metrics, including quarterly, monthly, and weekly profits. It also includes metrics for product distribution and profits by discount. This dashboard enables stakeholders to quickly analyze and make data-driven decisions to enhance profitability and identify growth opportunities.
Project Description: Financial Dashboard using Power BI for Comprehensive Business Analysis
The Financial Dashboard project aims to provide a comprehensive and intuitive visual representation of key financial metrics and performance indicators for business analysis. Built using the powerful data visualization tool Power BI, this project incorporates various features and metrics essential for evaluating business performance, including quarterly, monthly, and weekly profits, as well as product distribution and profits by discount.
The dashboard offers a user-friendly interface that allows stakeholders, managers, and decision-makers to gain valuable insights into the financial health of the business at a glance. Through interactive charts, graphs, and tables, users can explore and analyze data pertaining to profits, product distribution, and the impact of discounts on profitability.
Key Features:
- Profit Analysis: The dashboard provides a comprehensive breakdown of profits across different time periods, including quarterly, monthly, and weekly snapshots. Users can easily compare and identify trends, enabling informed decision-making and strategic planning.
- Product Distribution: Visual representations showcase product distribution across various categories, allowing users to understand which products contribute the most to overall revenue. This insight can be used to optimize inventory management and identify potential growth opportunities.
- Profitability by Discount: The dashboard highlights the impact of discounts on profitability. By examining the relationship between discounts and profits, users can assess the effectiveness of pricing strategies and make data-driven decisions to maximize revenue while maintaining healthy profit margins.
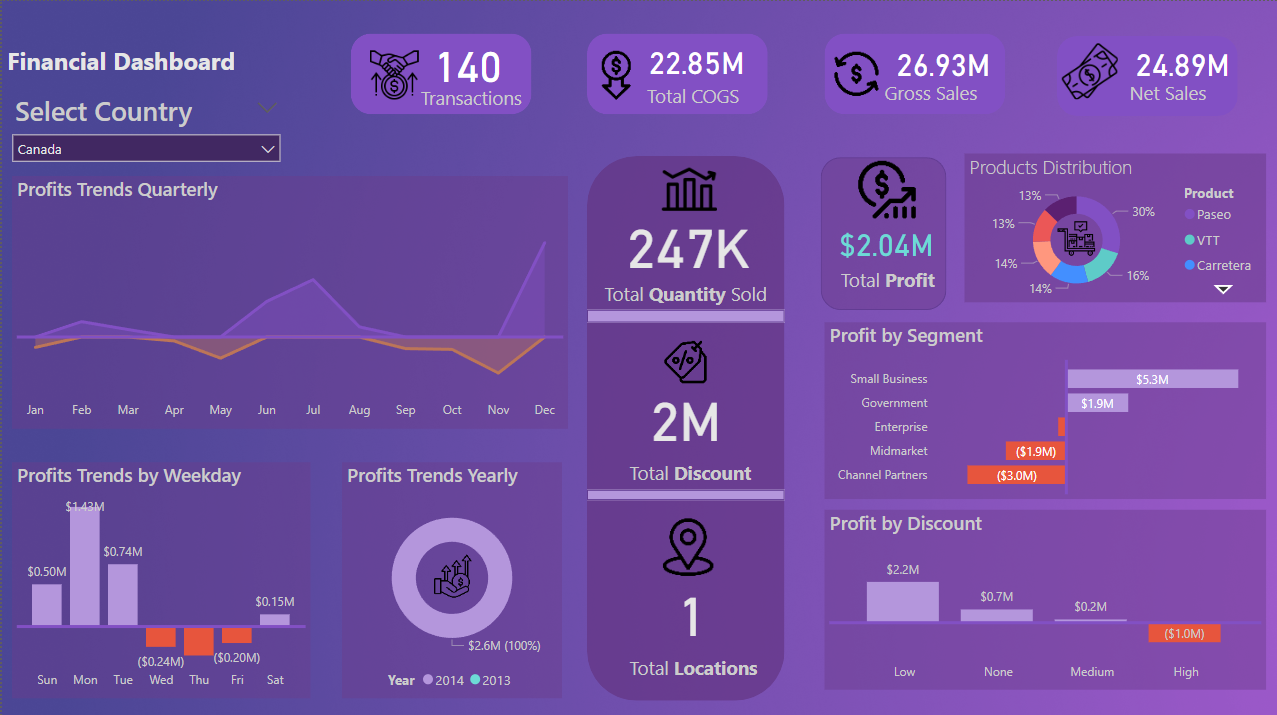
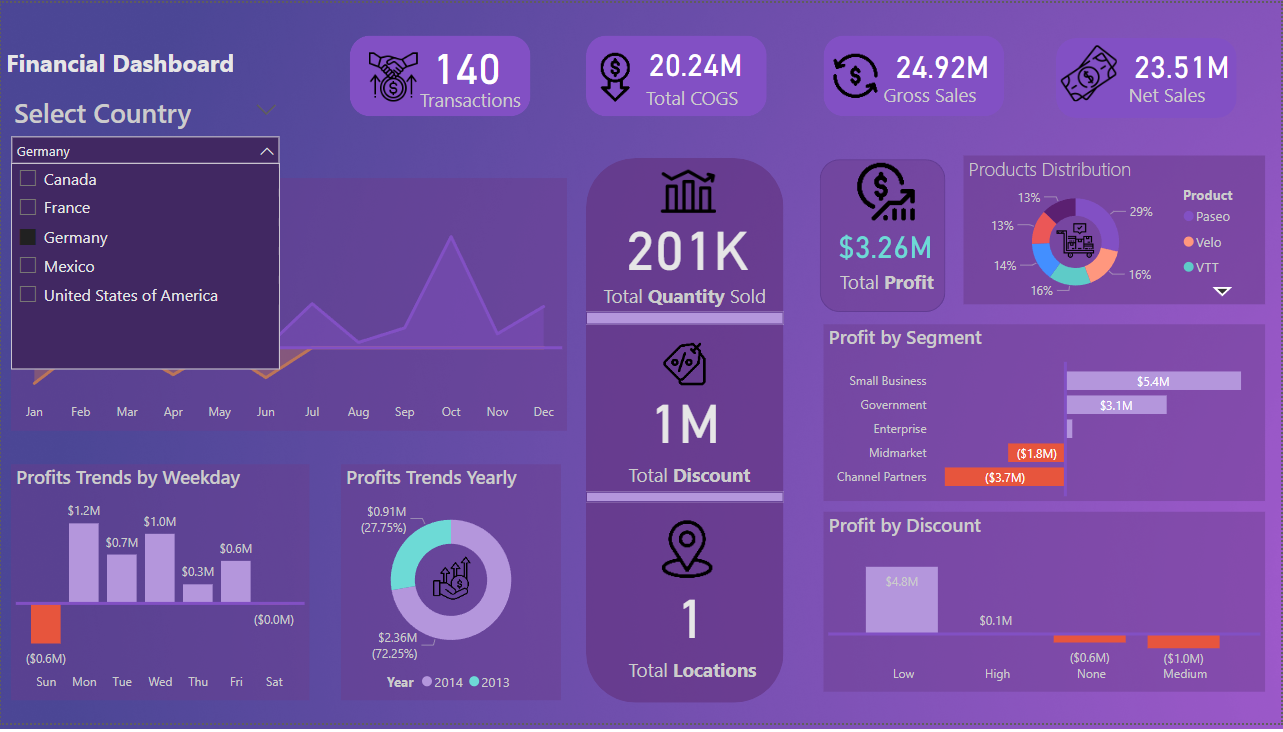
- Interactive Visualization: Users can interact with the dashboard, dynamically filtering data based on specific criteria, such as time periods, product categories, or discount ranges. This interactive functionality enhances the ability to explore and drill down into specific areas of interest.
Overall, the Financial Dashboard using Power BI provides a comprehensive overview of financial performance, allowing businesses to make data-driven decisions, optimize operations, and identify growth opportunities. With its user-friendly interface and powerful visualizations, the dashboard empowers stakeholders to gain valuable insights and take proactive steps to improve profitability and drive business success.