Project information
- Category:Power Bi
- Software Used :Power Query, Microsoft Power Bi
- Project URL: www.github.com
Project Description
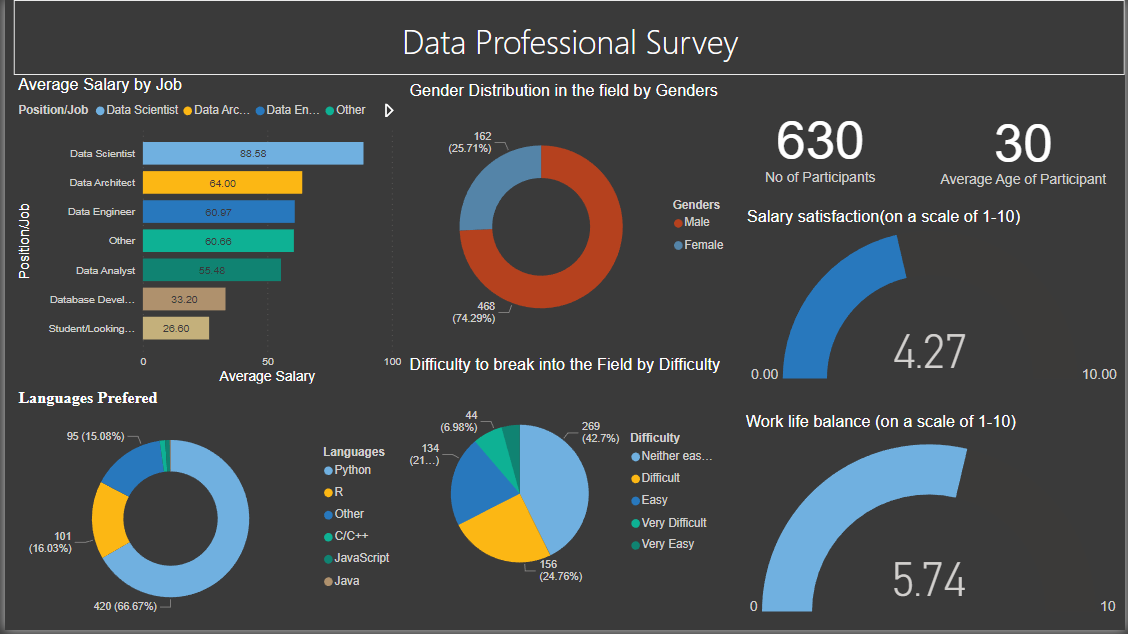
This project aims to visualize the results of a comprehensive data professionals survey using Power BI. The Data set is obtained from a survey conducted in a community that consists of data professionals of various backgrounds and age groups making for a reliable and varied data set.
Project Description: Analysis of a data professional survey to discover trends and patterns
This project aims to visualize the results of a comprehensive data professionals survey using Power BI, providing attractive and interactive visualizations to uncover meaningful insights into various aspects of the data industry. The survey collected data on positions, salaries, gender ratios, preferred programming languages, work-life balance, and overall happiness within the data profession.
Key Features:
- Position Analysis: Engage users with visually striking charts and graphs that showcase the distribution of data professionals across different job roles, highlighting the most common positions within the industry.
- Position Analysis: Engage users with visually striking charts and graphs that showcase the distribution of data professionals across different job roles, highlighting the most common positions within the industry.
- Gender Ratio Insights: Create visually appealing infographics to depict the gender distribution within the data profession, shedding light on any gender imbalances and emphasizing the importance of diversity and inclusion.
- Preferred Languages: Utilize visually captivating graphics to illustrate the most commonly used programming languages among data professionals, showcasing trends and changes over time. Use visually appealing icons or color schemes to represent different languages.
- Work-Life Balance Analysis: Present visually stunning charts and graphs to analyze work-life balance within the data profession. Incorporate interactive elements to allow users to explore factors such as average working hours, flexible working arrangements, and job satisfaction.