Project information
- Category:Tableau
- Software Used :SQL, Tableau
- Project URL: www.github.com
Project Description
This personal portfolio project dives into the captivating realm of the Airbnb hotel market, utilizing Tableau to create interactive visualizations based on real-world data from Kaggle. With a focus on prices and booking details, the project offers valuable insights and data-driven narratives to enhance understanding and decision-making.
Project Description: Analyse the data effectively inorder to know what rooms are in more demand and use data driven decision making to make informed decisions that drives growth.
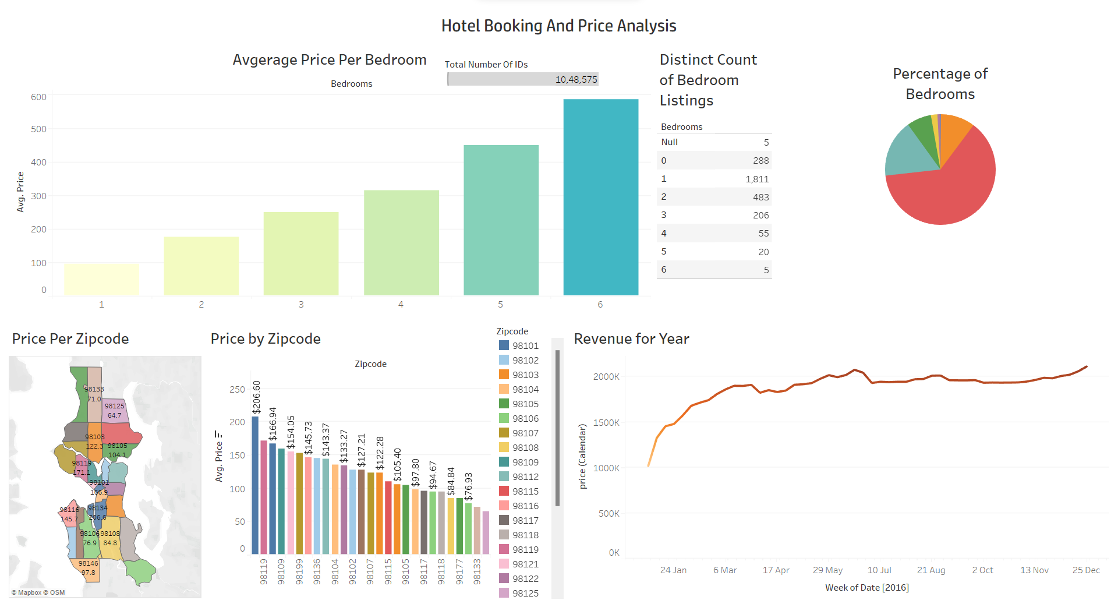
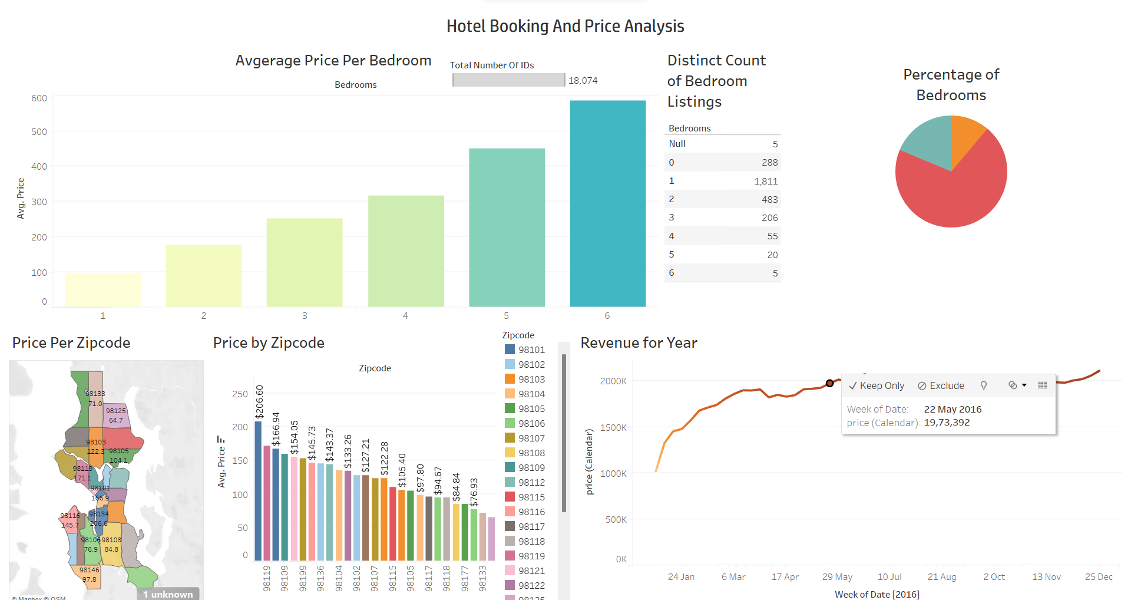
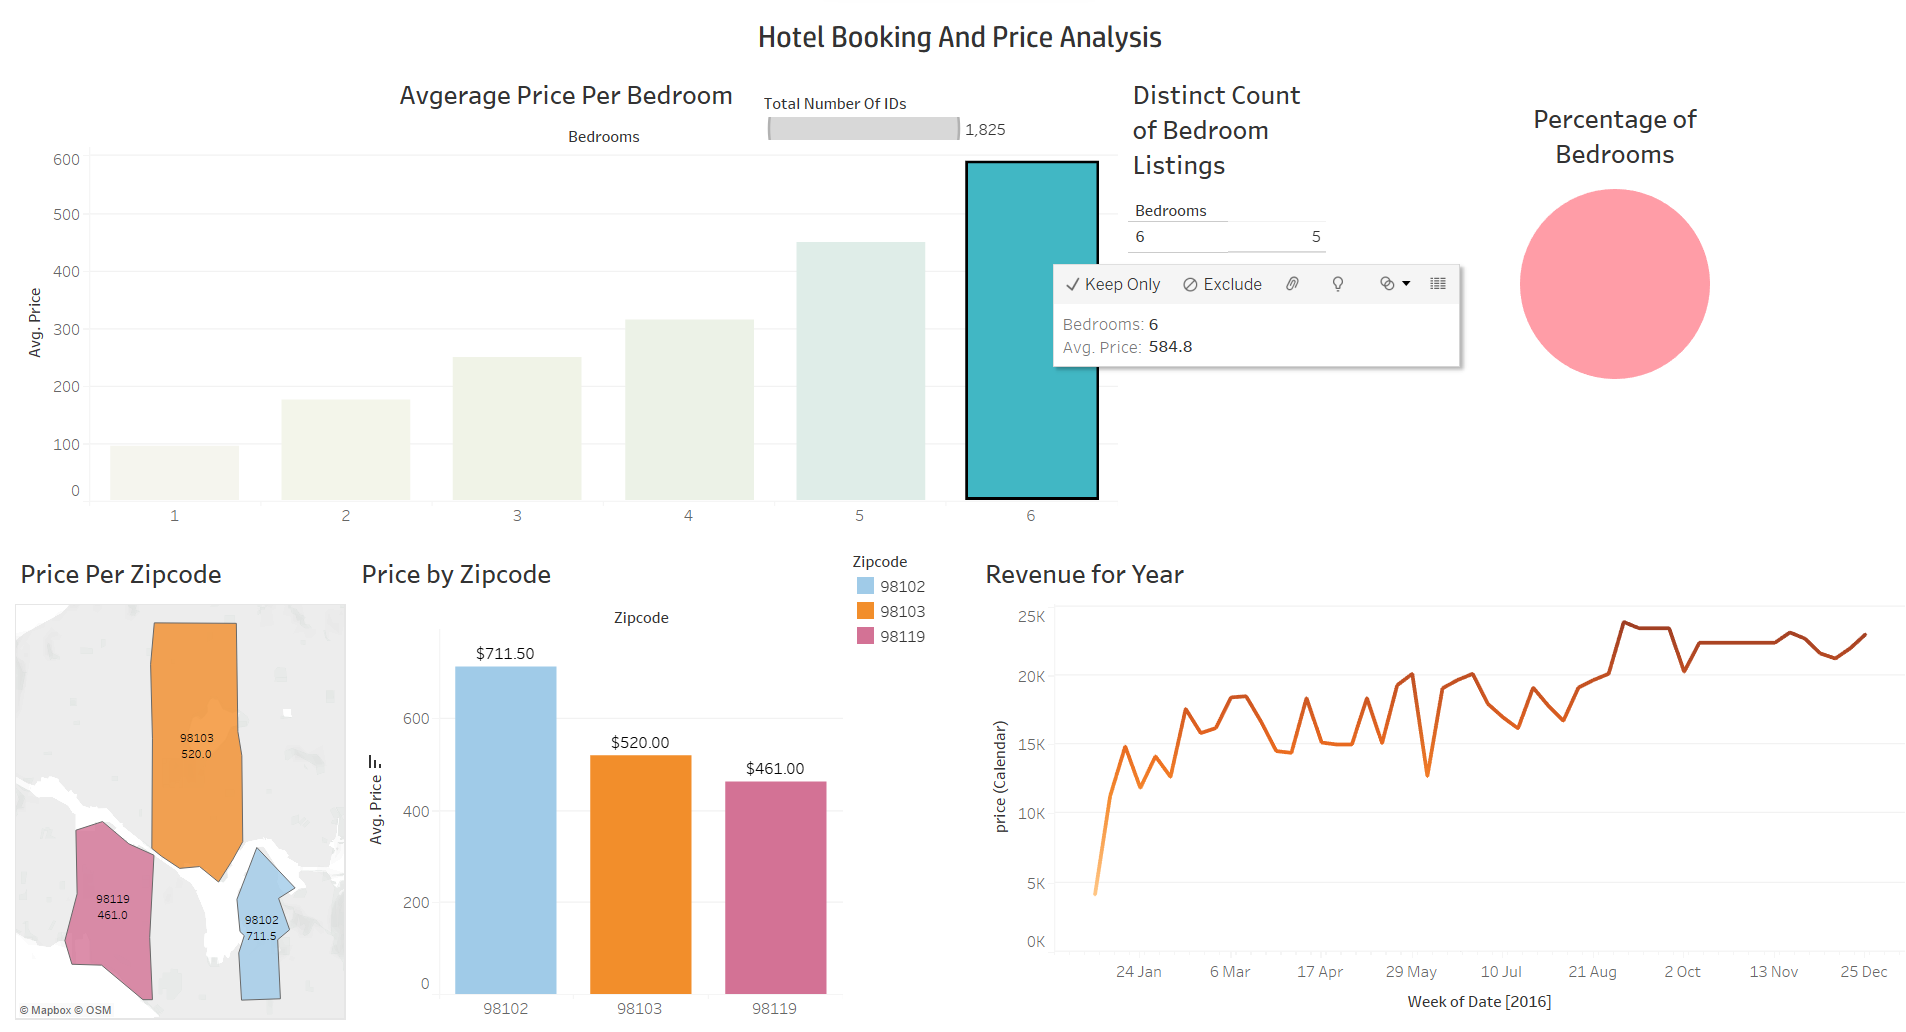
The journey of this personal portfolio project has been an exciting exploration into the world of Airbnb hotels. Starting with real-world data from Kaggle, the project focused on creating interactive visualizations to uncover valuable insights. By diving into pricing dynamics, revenue trends, bedroom distributions, and the relationship between prices and zipcodes, the project aimed to provide users with a clearer understanding of the Airbnb hotel market. Each step along the way brought new discoveries and transformed the data into captivating narratives, empowering users to make informed decisions and tap into the market's potential.
Key Features:
- Average Price for Hotels: Explore the relationship between hotel prices and the number of rooms available, gaining insights into affordability and comfort.
- Revenue by Year: Track the financial growth of the Airbnb hotel market over time, identifying key periods of growth and understanding market trends.
- Percentage of Bedrooms: Visualize the distribution of bedrooms across different room types, uncovering popular configurations and informing decision-making.
- Percentage of Bedrooms: Visualize the distribution of bedrooms across different room types, uncovering popular configurations and informing decision-making.
- Interactive Visualizations: Engage with the data through interactive and visually appealing visualizations, enhancing understanding and exploration.
- Real-World Data: Utilize Airbnb hotel data from Kaggle, ensuring the project reflects the current market and provides relevant insights.
- Data-Driven Decision-Making: Empower users to make informed decisions based on the insights and trends extracted from the visualizations.
- User-Friendly Interface: Enjoy a seamless and intuitive user experience, making it easy to navigate and interact with the project
- Insights for Travelers and Entrepreneurs: Cater to both travelers seeking optimal accommodation options and entrepreneurs looking to unlock potential opportunities within the Airbnb hotel market.
- Personal Portfolio Showcase: Highlight technical proficiency in data visualization and demonstrate a deep understanding of the Airbnb hotel market through a compelling and well-executed project.
In conclusion, this personal portfolio project has been a thrilling and enlightening journey through the intricacies of the Airbnb hotel market. Through the meticulous analysis and visualization of real-world data, key insights have been uncovered, shedding light on pricing dynamics, revenue trends, bedroom distributions, and the impact of location on prices. The interactive visualizations have not only provided a captivating experience but also empowered users to make informed decisions and navigate the ever-evolving landscape of Airbnb accommodations.